Curves
The Curves command, like the Levels/Histogram function, can be used to manipulate a picture's brightness, contrast, and tonal range. Unlike the Levels/Histogram command which can adjust only black, middle grey and white tones, the Curves command can have any number of control points. This allows for more precise and complex adjustments to the tonal range.
For more information about a specific item, click the image above.
The original picture and the effects of your changes are shown in the Before and After preview windows. Drag the vertical slider to adjust the magnification level of the preview images. Click the ![]() button to shrink the preview images so that they fit completely within the preview window, or click the
button to shrink the preview images so that they fit completely within the preview window, or click the ![]() button to display the preview image actual size (1:1). If needed, you may move the preview to display a different portion of the picture using the scroll bars or by dragging its center with the mouse. The
button to display the preview image actual size (1:1). If needed, you may move the preview to display a different portion of the picture using the scroll bars or by dragging its center with the mouse. The ![]() button can be used to quickly zero in on a specific area of the picture.
button can be used to quickly zero in on a specific area of the picture.
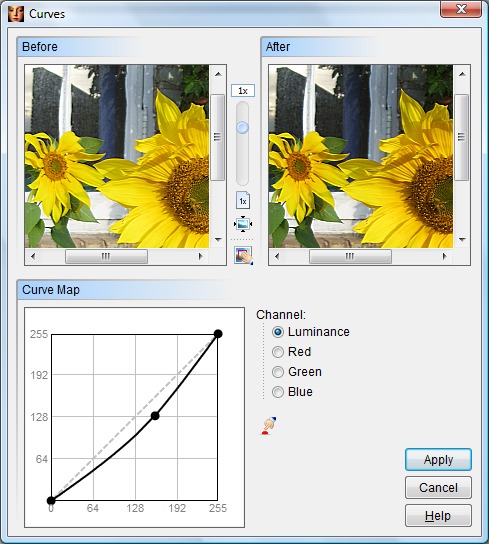
Select the color channel you wish to adjust. For the majority of images, the Luminance channel (a composite of all three RGB channels) will produce the best results. However, it can sometimes be helpful to make adjustments to an individual color channel. For example, you could use the Red channel option to adjust a picture that contained too much or too little red.
The horizontal axis of the Curve Map represents the original brightness values of each pixel in the picture. The vertical axis represents the new brightness values set by you. The purpose of the Curves tool is to re-map these brightness values (either darker or lighter) and hopefully improve the picture's appearance.
The graph Initially appears as a straight line because you haven't yet re-mapped any of the picture's pixels. To edit the picture, you need to change the straight line to a curve. You can do this by clicking the left mouse button somewhere on the line. This will add a control point which you can drag to a different location on the graph. The further you drag the point away from its original position, the greater the change in the tonal value. To remove a control point, click the point with the right mouse button.
The location of the control point is important. The two control points that were already added to the graph represent black and white. Dragging the black control point (in the lower left corner) will make the dark portions of the picture lighter or darker. The white control point (in the upper right corner) can be dragged to make the light portions of the picture lighter or darker. The line represents a gradation from black to white. The location on the line where you click to add your own control points will affect the tonal values of pixels that match that location. For example, if you clicked exactly midway between the back and white points, the new control point would affect pixels in the middle grey range.
The Reset button ![]() can be used to restore the picture and the curve map to their original states.
can be used to restore the picture and the curve map to their original states.
When you are satisfied with your settings, click the Apply button to modify your picture or selection.